이전 1편은 Loki에 대해 이야기했다.
2025.01.19 - [개발 아카이브] - Grafana LGTM 톺아보기 (1) - Loki 란?
Grafana LGTM 톺아보기 (1) - Loki 란?
사내에서는 서버의 트래픽을 모니터링하기 위해 datadog 솔루션을 사용하고 있다.물론 너무너무 좋은 서비스긴 하지만, 비용이 고비용이다. 아무리 좋은 서비스도, 우선 백엔드 팀만, 장애가 났을
sienna1022.tistory.com
이번에는 Grafana LGTM 의 약자에는 들어가지 않지만 LGTM 이 작동할 수 있게 하는 데이터 수집기 Alloy에 대해 알아보자.

어쨋든 우리가 원하는건 서버가 돌아갈 때, 서버의 이벤트들을 모조리 수집해서 그에 맞게 가공하는 것이다.
가공 담당이 LGTM 이라면, 실제 서버에서 데이터를 수집하는게 Alloy이다.
Grafana Alloy는 앞서 언급한 OpenTelemetry(Otel) collector의 배포판이다.
Alloy의 가장 큰 목적은, 다른 오픈 소스들의 생태계와 호환이 되고, 대규모 운영을 간소화 시켜주는 수집기가 되고 싶어한다.
Big Tent 가 되고 싶어한다는데,이게 무슨 의미인지 모르겠다

작동 방식
1. Collect
Alloy는 애플리케이션이나, DB 등등에서 측정 가능한 데이터를 수집하기 위해 120개의 컴포넌트를 사용한다.
측정 가능한 데이터는 Alloy로 보내지거나, Alloy가 가져온다
앱에서 Alloy로 데이터를 보낼 수도, Alloy에서 앱의 앤드포인트를 찔러서 가져올 수도
2. Transform
Grafana Alloy는 데이터를 다른 곳에 보내기 위해 가공한다.
변환된 데이터는 필터링이 되거나 다른 메타데이터를 위해 사용될 수 있다.
3. Write
Alloy는 Open Telemtry 에 호환적인 db 나 수집기로 데이터를 보낸다.
이 수집기가 LGTM 이 될 것이다.
각 수집기는 alloy 가 보낸 데이터를 받아서 각자 목적에 맞게 사용할 것이다.

다음 Alloy Configuaration Syntax 설정 파일이 이 일련의 작동 방식을 보여준다
공식 문서 보고 필자가 쓴거라..오류가 있을 수 있다.
// 1. Collection
// 로컬 파일 시스템에서 특정 로그 파일을 찾고 이를 alloy 에서 사용할 수 있도록 마운트함.
local.file_match "applogs" {
    path_targets = [{"__path__" = "/tmp/app-logs/app.log"}]
}


loki.source.file "local_files" {
	// 위에서 찾은 로그 파일을 입력을 받고
    targets    = local.file_match.applogs.targets

    // 로그 데이터를 loki.process.add_new_label.receiver가 처리하도록 전달한다.
    forward_to = [loki.process.add_new_label.receiver]
}

// 2. Transformation
// 위에서 loki.process.add_new_label.receiver가 처리하도록 했는데, 여기에서 받을 것이다.
// 여기에서 가공을 한다.

loki.process "add_new_label" {
	// level 이라는 필드를 찾아 extracted_level이라는 변수로 저장한다.
    // level 이 error면 extracted_level=error가 될 것.
    stage.logfmt {
        mapping = {
            "extracted_level" = "level",
        }
    }

    //추출한 extracted_level 을 level 이라는 라벨로 단다.
    // level 이라는 라벨은 error 가 될 것이다.
    stage.labels {
        values = {
            "level" = "extracted_level",
        }
    }

    // 이 데이터를 받을 다음 단계를 정의한다 = write component 가 될 것이다.
    forward_to = [loki.write.local_loki.receiver]
}

// 3. Write
// Loki를 예시로, 이 데이터가 쓰여질 Write Component 를 정의한다.
loki.write "local_loki" {
    endpoint {
        url = "http://loki:3100/loki/api/v1/push"
    }
}
이 syntax가 어떻게 이루어져있을까?
1. Blocks
// blocks
prometheus.remote_write "default" {
  endpoint {
  	// attributes
    url = "http://localhost:9009/api/prom/push"
  }
}
중첩 구조로 이루어져있는 attributes 혹은 blocks로 이루어져있다.
promethus. remote_write 컴포넌트 명, default 라는 라벨이 달려있다.
endpoint : 라벨이 없는 블록.
2. Attributes
Attributes는 항상 다음과 같은 형식이다.
ATTRIBUTE_NAME = ATTRIBUTE_VALUE
예시는 다음과 같다
log_level = "debug"
3. Expressions
attributes를 나타내기 위해 다양한 표현이 있다.
- Referencing the exports of components: local.file.password_file.conten
- Mathematical operations: 1 + 2, 3 * 4, (5 * 6) + (7 + 8)
- Equality checks: local.file.file_a.content == local.file.file_b.content
- Calling functions from Alloy’s standard library: sys.env("HOME") retrieves the value of the HOME environment variable.
Components
Alloy는 컴포넌트들을 조합하여 시스템이 구축된다.
근데 위에 blocks 와 components는 결국 같은거 아닌가? 논리적으로 다른걸까?
각 컴포넌트들은 하나의 역할을 담당한다. 예를 들면 secret을 검색하거나 프로메테우스 데이터를 수집하거나
Components는 Arguments 와 exports 로 이루어져있다.
Arguments : Component를 구성하는 설정
Exports : 다른 컴포넌트에게 노출되기 위한 이름
각 컴포넌트들은 담당하는 역할을 드러내기 위한 이름을 가지고 있다.
• local.file → 로컬 파일의 내용을 가져오는 역할
• discovery.kubernetes → Kubernetes 환경에서 리소스를 찾는 역할
• loki.source.file → 파일 기반 로그를 수집하는 역할
하지만 label 에 따라 컴포넌트들이 다르게 인식 될 수 있다.
둘다 discvoery.kubernates 라는 컴포넌트지만, pods, nodes 처럼 별칭을 다르게 정의해서 다른 역할을 부여할 수 있다
discovery.kubernetes "pods" {
  role = "pod"
}

discovery.kubernetes "nodes" {
  role = "node"
}
외부에서 참조하는 방법은 discovert.kubernates.pods 처럼 참조하면 된다.
이게 왜 필요하냐면, 동적인 값이 필요할 때도 있지만 다음과 같이 컴포넌트 들 끼리 동적인 값이 필요할 때가 있다.
동적인 파이프라인을 구성해야할 때 쓰인다.
다음과 같은 상황이 필요하다면, 다음과 같이 파이프라인을 구성해서 가져올 수 있다.
이게 모아져서 일련의 syntax가 되는 것이라고 생각한다.
1. local.file 이라는 컴포넌트는 api 키를 가진 파일을 참조한다.
2. prometheus.remote_write 컴포넌트는 local.file로 부터 키를 받으면 원격 db 로 데이터를 전송한다.
local.file "api_key" {
  filename  = "/var/data/secrets/api-key"

  is_secret = true
}

prometheus.remote_write "prod" {
  endpoint {
    url = "https://prod:9090/api/v1/write"

    basic_auth {
      username = "admin"

      // 다른 컴포넌트에서 키를 가져온다
      password = local.file.api_key.content
    }
  }
}
그렇다면 여기까지는 alloy의 기본 동작이다.
그렇다면 어떻게 서버에 설치를 하는가??
필요한 기능에 맞는 components를 정의한 alloy.config 파일을 정의하면 된다.
linux 는 /etc/alloy/config.alloy 경로에 넣으면 된다.
이미 alloy는 필요한 기능에 맞는 컴포넌트들을 제공하고 있고 대략 다음과 같다.
어떤 components가 있는지는 공식문서에 다양하게 적혀있다.
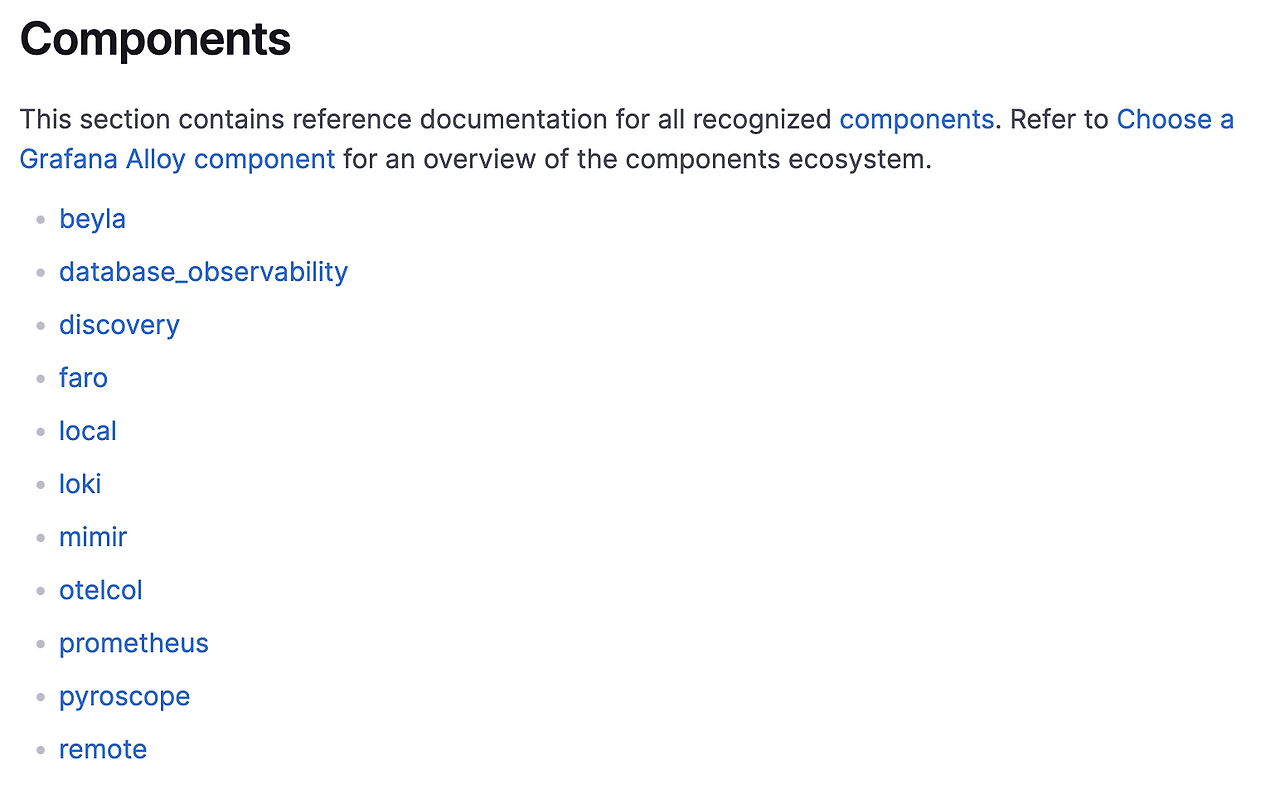
1. Prometheus
컴포넌트 명 : promethues.*
인프라를 위한 매트릭 수집.
linux Host 같은 건 prometheus.exporter.unix, MongoDB 관련은 prometheus.exporter.mongodb 와 같은 컴포넌트로
매트릭을 수집할 수 있고, promethues.scrape 과 같이 아무 앤드포인트나 수집할 수 있다.
2. OpenTelemtry
컴포넌트 명 : otelcol.reciever.*
애플리케이션 매트릭을 위한 수집
3. Logs
인프라 로그 수집 컴포넌트 명 : : loki.*
애플리케이션 로그 수집 컴포넌트 명 : : otelcol.reciever.*
4. Trace
컴포넌트 명 : otelcol.receiver.*
5. Profiles
컴포넌트 명 : pytoscope.*
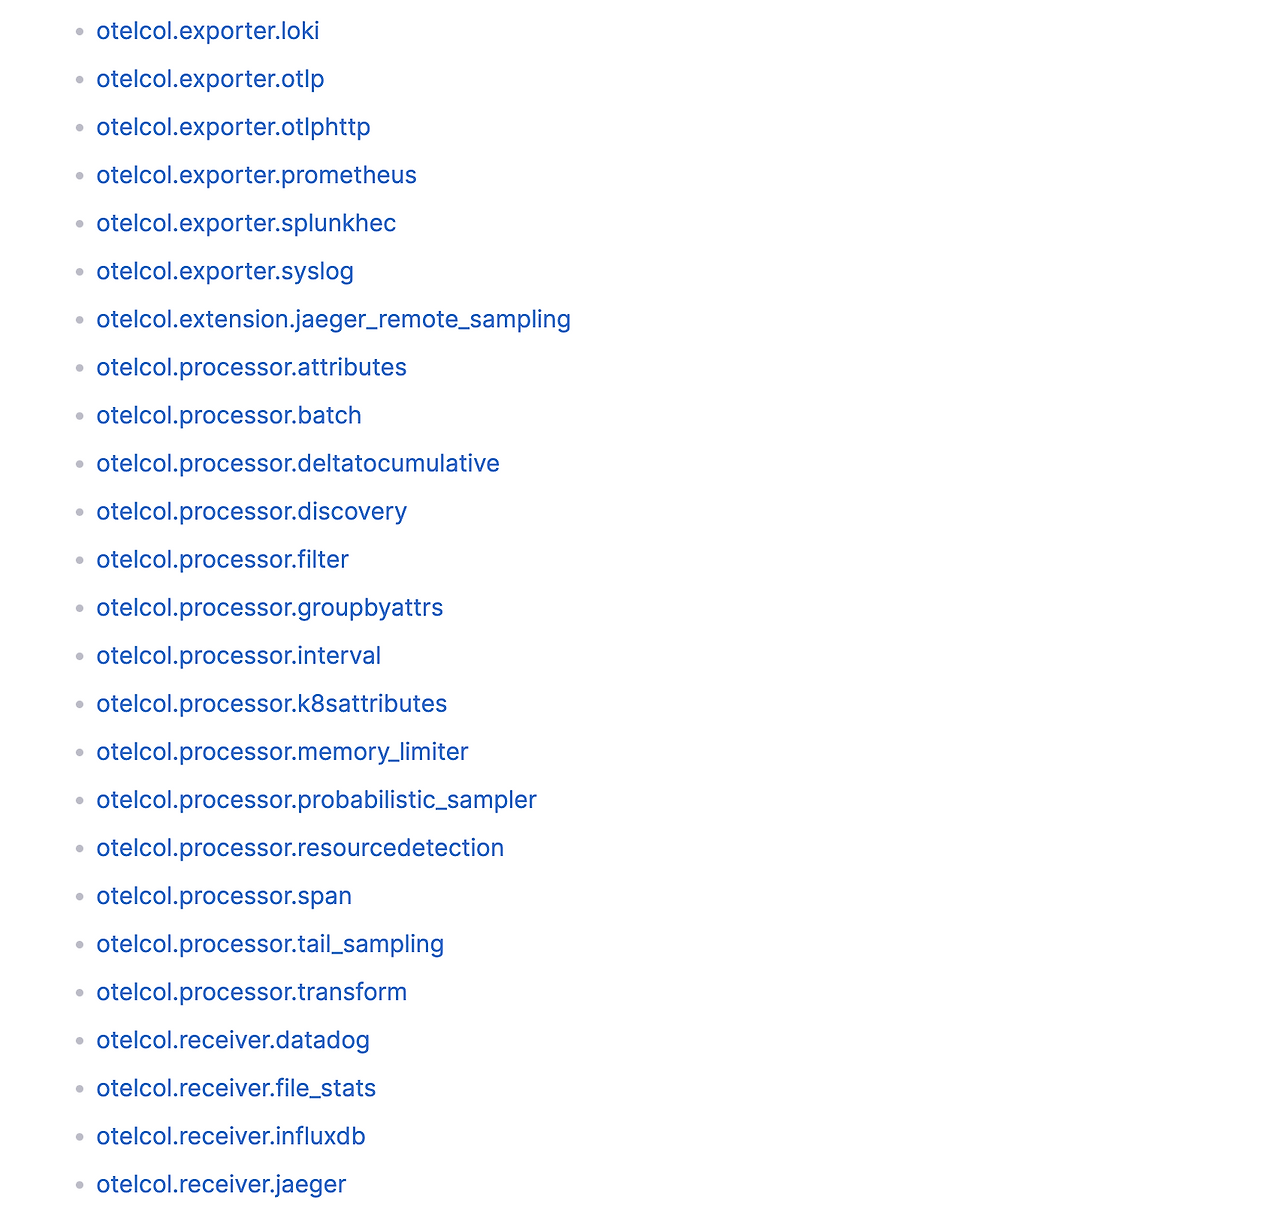
각 component를 보면, alloy의 큰 세단계 역할에 맞게 components가 세분화되어있다
1. Collect
2. Transform
3. Write
OtelCol componets 내부를 보면 다음과 같이 매핑할 수 있다.
1. Collect - otelcol.exporter.*
2. Transform - otelcol.processor.*
3. Write - otelcol.receiver.*
그래서 나는 어떤 components를 썻냐면
prometheus 와 otel 기반 component 를 사용했다.
둘은 사실 비슷한 component이고 수집하는 데이터가 다르다는 차이점이 있다.
사실 거의 비슷함.
1. Prometheus
prometheus는 주로 매트릭(시계열 데이터)를 수집하고, 이는 node_epxorter로 linux와 같은 os에서 시스템 성능을 모니터링하는데 사용된다.
1. promethus.exporter.unix components 수집기
사내에서는 NodeJs 환경에 linux 기반 서버를 사용하고 있다.
따라서 promethus.exporter.unix components 를 사용했다
수집하는 collectors list 는 대략 다음과 같다. 너무 많아서 예시로 각2개씩만
cpu 관련 지표
- cpu :CPU 사용량, 코어 개수, 컨텍스트 스위칭 등 CPU 성능 정보 제공.
- interrupts: CPU 인터럽트 발생 횟수 제공.
네트워크 관련 지표
- ipvs: 리눅스 IP 가상 서버(IPVS) 로드 밸런서 상태 정보 제공.
- netstat: /proc/net/netstat에서 TCP, UDP 등 네트워크 프로토콜 상태 제공.
메모리 및 파일 지표
- meminfo: /proc/meminfo에서 메모리 사용량 제공 (RAM, 캐시, 버퍼 등).
다음과 같이 arguments를 블록에 정의하면 된다.
 prometheus.exporter.unix "default" {
    include_exporter_metrics = true //exporter 자신이 리포팅되어야하는지, 우리는 alloy를 모니터링해야할 대상 서버에 설치함으로 이건 true
    disable_collectors       = ["mdadm"] // mdadm collector는 disable 처리함
  }
disable collectors에 넣지 않는 이상 collectors는 모두 default로 적용된다.
2. prometheus.scrape 전송용
Prometheus가 어떤 대상(targets)에서 메트릭을 수집할지 정의하고 어디로 이 데이터를 보낼지 정의한다
prometheus.scrape "default" {
    // 어떤 데이터를 수집해서
    targets = array.concat(
      promethus.exporter.unix.default.targets,
      [{
        // 우리는 alloy가 돌고 있는 서버 데이터를 가져올 것이므로 이를 가져오도록 주소를 추가한다.
        job         = "alloy",
        __address__ = "127.0.0.1:12345",
      }],
    )
    // 어디로 보낼지? : remote_write component로
    forward_to = [prometheus.remote_write.default.receiver]
  }


  prometheus.remote_write "default" {
    endpoint {
      url = "$PROMETHEUS_URL"
    }
  }
2. OtelCol
OTLP(OpenTelemetry Protocol)는 메트릭, 로그, 트레이스 데이터를 전송하는 표준 프로토콜이다.
otelcol 구성에서 원격 측정 데이터를 보내기 전에 모아두었다가, 일괄 처리하는 component
1. otelcol.receiver.otlp (수집)
- grpc : grpc 프로토콜을 사용해 수집할 서버의 앤드포인트 정의
- http : http 프로토콜을 사용해 수집할 서버의 앤드포인트 정의
- output : 어디로 수집한 데이터를 보낼지 정의
2. otelcol.processor.batch(가공)
otelcol 에서 측정 데이터를 보내기 전에 모아두었다가, 일괄 처리하는 component
- timeout
- send_batch_size
이런 옵션을 주어서, 배치 요소를 정할 수 있다.
배치는 데이터 압축을 개선하고, 데이터를 전송하는데 필요한 나가는 네트워크 요청 수를 줄인다.
3. otelcol.exporter.otlphttp (전송)
데이터를 어디로 보낼지 정의한다.
우리는 모니터링 서버로 보내야하므로 해당 주소를 입력하면 된다.
// 애플리케이션이 보낸(여기서는 같은 Local 서버)데이터를 수집한다.
// 어떤 데이터를 수집할지 정의
 otelcol.receiver.otlp "default" {
    grpc {
      endpoint = "0.0.0.0:4317"
    }

    http {
      endpoint = "0.0.0.0:4318"
    }
}
	// 수집한 데이터를 어디로 보낼지
    output {
      metrics = [otelcol.processor.batch.default.input] //아래에 별도 block으로 정의
      logs    = [otelcol.processor.batch.default.input]
      traces  = [otelcol.processor.batch.default.input]
    }
  }


// 어떤 데이터를 어떻게 가공할건지
  otelcol.processor.batch "default" {
    output {
      metrics = [otelcol.exporter.prometheus.default.input]
      logs    = [otelcol.exporter.otlphttp.logs.input]
      traces  = [otelcol.exporter.otlphttp.traces.input]
    }
  }


//어디로 보낼지
 otelcol.exporter.otlphttp "logs" {
    client {
      endpoint = "$LOKI_URL"
      auth = otelcol.auth.headers.tenant_id.handler
    }
  }

// 트레이스는 어디로 보낼지
otelcol.exporter.otlphttp "traces" {
    client {
      endpoint = "$TEMPO_URL"
      auth = otelcol.auth.headers.tenant_id.handler
    }
    retry_on_failure {
      enabled = false
    }
  }
전반적으로 다음과 같은 파일을 만들 수 있을 것이다.
prometheus.exporter.unix "default" {
  include_exporter_metrics = true
  disable_collectors       = ["mdadm"]
}

prometheus.scrape "default" {
  targets = array.concat(
    prometheus.exporter.unix.default.targets,
    [{
      // Self-collect metrics
      job         = "alloy",
      __address__ = "127.0.0.1:12345",
    }],
  )
  forward_to = [prometheus.remote_write.default.receiver]
}

logging {
  level    = "info"
  format   = "json"
}

tracing {
  sampling_fraction = 0.2 // 0.1
  write_to          = [otelcol.exporter.otlphttp.traces.input]
}

otelcol.receiver.otlp "default" {
  grpc {
    endpoint = "0.0.0.0:4317"
  }

  http {
    endpoint = "0.0.0.0:4318"
  }

  output {
    metrics = [otelcol.processor.batch.default.input]
    logs    = [otelcol.processor.batch.default.input]
    traces  = [otelcol.processor.batch.default.input]
  }
}

otelcol.processor.batch "default" {
  output {
    metrics = [otelcol.exporter.prometheus.default.input]
    logs    = [otelcol.exporter.otlphttp.logs.input]
    traces  = [otelcol.exporter.otlphttp.traces.input]
  }
}

otelcol.exporter.prometheus "default" {
  forward_to = [prometheus.remote_write.default.receiver]
}

prometheus.remote_write "default" {
  endpoint {
    url = "$PROMETHEUS_URL"
  }
}

otelcol.exporter.otlphttp "logs" {
  client {
    endpoint = "$LOKI_URL"
  }
}

otelcol.exporter.otlphttp "traces" {
  client {
    endpoint = "$TEMPO_URL"
  }
  retry_on_failure {
    enabled = false
  }
}
'개발 아카이브' 카테고리의 다른 글
| Grafana LGTM 톺아보기 (4) - Mimir 란? (3) | 2025.03.02 |
|---|---|
| Grafana LGTM 톺아보기 (3) - Tempo 란? (4) | 2025.02.16 |
| Grafana LGTM 톺아보기 (1) - Loki 란? (5) | 2025.01.19 |
| 당근 채팅 시스템은 어떻게 만들까? (5) | 2024.12.08 |
| slack 파일 업로드, completeUploadExternal(),getUploadURLExternal() 사용법 (3) | 2024.11.19 |